
Lifestyle
How to Find the Mean of a Sample – Basic Statistical Calculations

Greetings! Today, I will guide you through the process of finding the mean of a sample, one of the most fundamental statistical calculations. The mean is a measure of central tendency that represents the average value of a set of numbers. Whether you are a student, researcher, or simply curious about statistics, understanding how to calculate the mean is essential for interpreting data. I will explain the steps to calculate the mean, the significance of this measure, and how to avoid common errors in the process. By the end of this blog post, you will have a firm understanding of this basic statistical calculation and feel confident in your ability to apply it to your own data sets.
Key Takeaways:
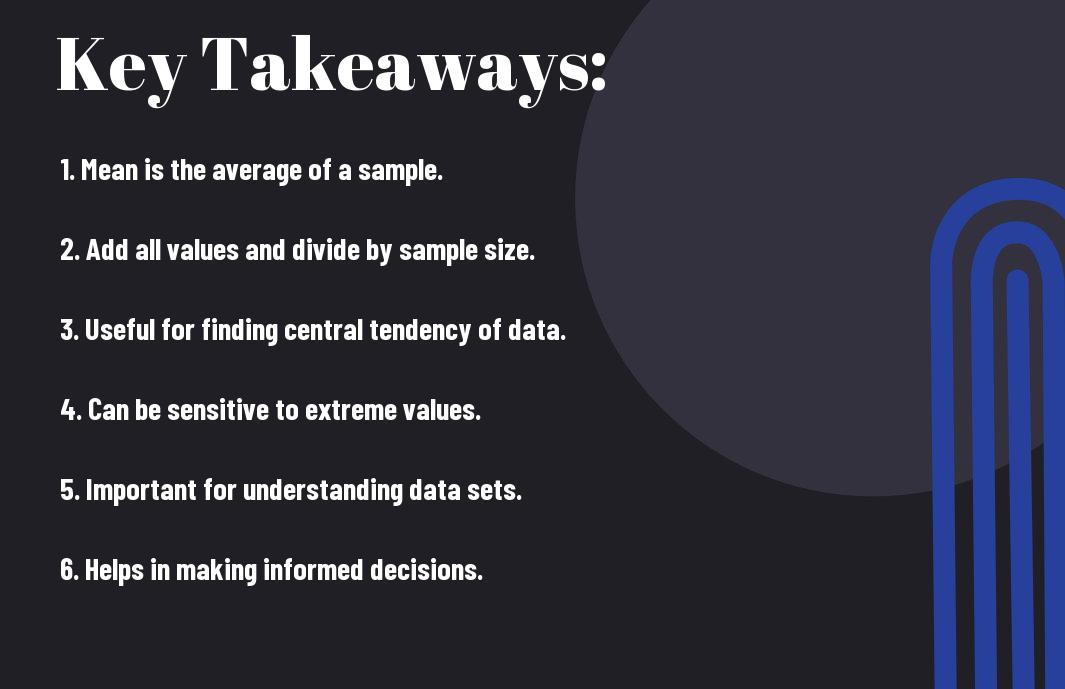
- Mean is the average: The mean of a sample is the average value of all the data points in the sample. It is calculated by adding up all the values and dividing by the number of values.
- Formula for mean: The formula for finding the mean of a sample is Σx/n, where Σx represents the sum of all the values in the sample and n represents the number of values in the sample.
- Mean is sensitive to outliers: The mean can be heavily influenced by outliers in the data, so it may not always accurately represent the central tendency of the sample.
- Importance of the mean: The mean is often used as a measure of central tendency and is a key component in many statistical calculations and analyses.
- Mean vs median: While the mean and median both represent central tendencies, the mean is more sensitive to outliers, while the median is a more robust measure in the presence of outliers.
Understanding the Mean
For me, the mean is one of the most basic and important statistical calculations. It is a measure of central tendency that represents the average of a set of numbers. Understanding how to find the mean is crucial for making sense of data and drawing meaningful conclusions.
Definition of Mean
When I say “mean,” I’m talking about the arithmetic average of a set of numbers. To find the mean, you add up all the numbers in the sample and then divide by the total number of data points. In mathematical terms, the mean can be expressed as: mean = (x1 + x2 + … + xn) / n, where x1, x2, … xn are the individual data points and n is the total number of data points. It is a simple yet powerful way to summarize a dataset and understand its central value.
Importance of Finding the Mean
Finding the mean is important because it gives you a quick snapshot of the average value in a dataset. Whether you’re analyzing test scores, sales figures, or any other type of data, the mean can help you understand the typical value and make comparisons. It is also a critical part of many other statistical calculations, such as standard deviation and hypothesis testing. Knowing the mean allows you to make informed decisions and draw accurate conclusions based on the data at hand.
Calculating the Mean
Any statistical analysis begins with finding the mean of a sample. The mean is a measure of central tendency, representing the average of a set of numbers. It is a vital statistical calculation that provides valuable insights into the data at hand. If you have questions about the process, you can read more about it here.
Step-by-Step Method for Finding the Mean
When calculating the mean, I typically use the following step-by-step method:
| Step 1 | Sum all the numbers in your sample |
| Step 2 | Count the total number of values in the sample |
| Step 3 | Divide the sum from Step 1 by the total count from Step 2 |
Mean Formula and Its Application
One of the most widely used formulas for calculating the mean is: Mean = (Sum of all values) / (Total count of values). This formula is applicable to both small and large data sets, allowing you to analyze and understand the central tendency of your sample with ease.

Using the Mean in Statistical Analysis
To find the mean of a sample is just the start. To fully utilize this statistical measure, it is essential to understand how to use the mean in statistical analysis. The mean, also referred to as the average, is a fundamental tool used in statistical analysis. It represents the typical value in a set of numbers and is useful for drawing conclusions about the overall characteristics of the data. For a comprehensive explanation of the sample mean and its applications in statistical analysis, you can refer to this article about the sample mean.
Interpreting the Mean in Data Sets
When interpreting the mean in data sets, it’s important to consider the context of the data and the distribution of values. The mean can be a useful tool for understanding the central tendency of a data set, but it must be used cautiously. Skewed distributions, outliers, and unequal sample sizes can all have a significant impact on the accuracy of the mean as a measure of central tendency. It is crucial to examine the entire data set and not rely solely on the mean to draw conclusions about the data.
Comparing Means in Different Samples
When comparing means in different samples, it is crucial to consider several factors that can affect the validity of the comparison. Sample size, variability within each sample, and the nature of the data must all be taken into account. An appropriate statistical test, such as a t-test or ANOVA, can help determine if the difference in means between samples is statistically significant. Below is a comparison table summarizing the factors to consider when comparing means in different samples:
Factors to Consider when Comparing Means in Different Samples
| Data Nature | Variability |
| Continuous or categorical | Differences in spread of values |
| Normal or non-normal distribution | Standard deviation or variance |
Conclusion
With these considerations in mind, finding the mean of a sample is a fundamental step in statistical calculations. By adding up all the data points and dividing by the number of points, you can find the average or central tendency of your sample. Understanding how to find the mean is crucial for interpreting data and making informed decisions based on your findings. I recommend practicing this basic statistical calculation to gain a better understanding of how to analyze and interpret data effectively. Utilizing the mean will help you make more informed decisions in various areas of your personal and professional life. Remember, practice makes perfect, so keep calculating the mean of different samples to strengthen your statistical skills.
FAQ
Q: What is the mean of a sample?
A: The mean of a sample, also known as the average, is the sum of all values in the sample divided by the total number of values. It is a measure of central tendency and is often used to represent the typical value of a set of numbers.
Q: How do I calculate the mean of a sample?
A: To calculate the mean of a sample, add up all the values in the sample and then divide the sum by the total number of values in the sample. For example, if you have a sample of 5 numbers (2, 4, 6, 8, 10), you would add them up (2 + 4 + 6 + 8 + 10 = 30) and then divide by 5 to get the mean (30 / 5 = 6).
Q: Why is finding the mean important in statistics?
A: Finding the mean is important in statistics because it provides a single value that represents the entire data set. It allows for easy comparison between different samples and provides a measure of central tendency, helping to understand the typical value of a set of data.
Q: What are the potential limitations of using the mean?
A: One potential limitation of using the mean is that it can be sensitive to extreme values, also known as outliers. If a sample contains extreme values, they can heavily influence the mean and provide a skewed representation of the typical value of the data set. In such cases, using median or mode may be more appropriate.
Q: How can I interpret the mean of a sample?
A: The mean provides a clear and simple interpretation of the average value of a sample. It can be used to compare different samples or track changes within a single sample over time. A higher mean indicates a higher average value, while a lower mean indicates a lower average value within the sample.

-
 Entertainment2 years ago
Does The Rock Have a Twin Brother? Exploring Celebrity Family Facts
-
 Lifestyle2 years ago
How Long Does a Killer Whale Live – What's Their Average Lifespan?
-
 Lifestyle2 years ago
How Many Hairs Are on a Human Head? Understanding Hair Density
-
 Lifestyle2 years ago
What Is an Industrial Plant? Exploring Industrial Facilities
-
 Technology2 years ago
How Far Can a Human Eye See – What's the Maximum Range?
-
 Lifestyle2 years ago
North Carolina Education Lottery App – Playing Lottery Games on Mobile
-
 Technology2 years ago
How Many People Can Solve a Rubik's Cube – Is It a Common Skill?
-
 Technology2 years ago
Is Dr. Pepper a Coke Product – Who Manufactures It?